How to trace and visualize POSIX threads
Writing even a simple multi-threaded program is a complex problem, synchronization issues are always around the corner, causing race conditions which can lead to deadlock or resource starvation; and the stress of not being sure that our program works correctly is another component of the complexity.
Designing the synchronization scheme with formalisms like Petri nets helps in validating the solution, but it still does not grant that the implementation will be correct.
Some programming languages, or some synchronization primitives, might make it easier to tackle the problems of simultaneity and parallelism, and help to avoid some common pitfalls, but the problem is complex by itself.
Having a tool which allows to trace, analyze, and maybe even visualize (with a sequence diagram, or a Gantt chart, or some other time-chart) the execution flow of the multi-threaded application can be useful to verify that our program is as less incorrect as possible.
The test case
As a simple test case let's use my experiment about double-buffering.
This may be an over-simplification as the time spent by the two threads between each synchronization point is quite stable and predictable, but it is still useful to show how the execution of the two threads overlap.
EzTrace and ViTE
The easiest way I found to visualize the runtime behavior of POSIX threads is the combination of EzTrace and ViTE.
Both are available in Debian:
$ sudo aptitude install eztrace vite
The steps to use them are:
- Set up the wanted EzTrace modules, there are modules for OpenMP and MPI, but for my tests I wanted to trace pthreads.
- Trace the program.
- Convert the trace to a format ViTE can understand.
- Visualize the trace.
Which translated in commands is:
$ export EZTRACE_TRACE="stdio pthread memory"
$ eztrace ./double-buffering
$ eztrace_convert -o double-buffering /tmp/ao2_eztrace_log_rank_1
$ vite double-buffering.trace
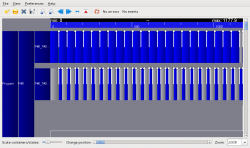
And something like the following will be shown, which gives an overview of how one run of the program behaved:
ptrace-tools
An alternative is ptrace-tools, which is not available in Debian, but it is easy to get and use:
$ git clone https://code.google.com/p/ptrace-tools/
$ cd ptrace-tools/ptrace-tool/
$ make
$ LD_LIBRARY_PATH=$(pwd) ./pthread-trace /path/to/double-buffering
$ ../ptrace-gui/ptracegui.py ptrace.log
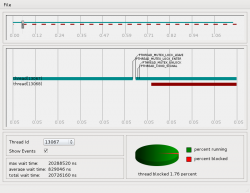
And here is the visual result:
Helgrind
Helgrind is a Valgrind tool to check for errors in the threading model of multi-threaded programs, but I didn't find a way to visualize the runtime behavior of the analyzed program.
LTTng
LTTng is often mentioned in discussions about tracing threads, but keep in mind that it is more of a system tracer/profiler then a application profiler. I wasn't able, for instance, to isolate one process and analyze only its threads.
A brief introduction can be found in Howto tracing with LTTng, but is it to note that the stable version of the visualization tool LTTV does not work with the traces generated with the stable lttng tools.
There is code in the development version of LTTV, in the babelproto git branch, which is able to do that tho, here are some hints for those who want to try it out:
$ sudo aptitude build-dep lttv
$ sudo aptitude install libbabeltrace-dev libbabeltrace-ctf-dev
$ git clone git://git.lttng.org/lttv.git
$ cd lttv
$ git checkout babelproto
$ ./bootstrap
$ mkdir build
$ BABELTRACE_CFLAGS=-I/usr/include/ BABELTRACE_LIBS="-lbabeltrace -lbabeltrace-ctf" ./configure --prefix=$(pwd)/build
$ make
$ make install
$ ./build/bin/lttv-gui


![Valida il feed RSS [RSS Valido]](https://ao2.it/sites/default/files/valid-rss-rogers.png)

Commenti
What is the relation between
What is the relation between a pthread id (within a process context) and the ids presented by eztrace?
Claudio, I am not sure. If
Claudio, I am not sure. If you do any tests to find out please let me know.
Invia nuovo commento